
 DUKE
DUKE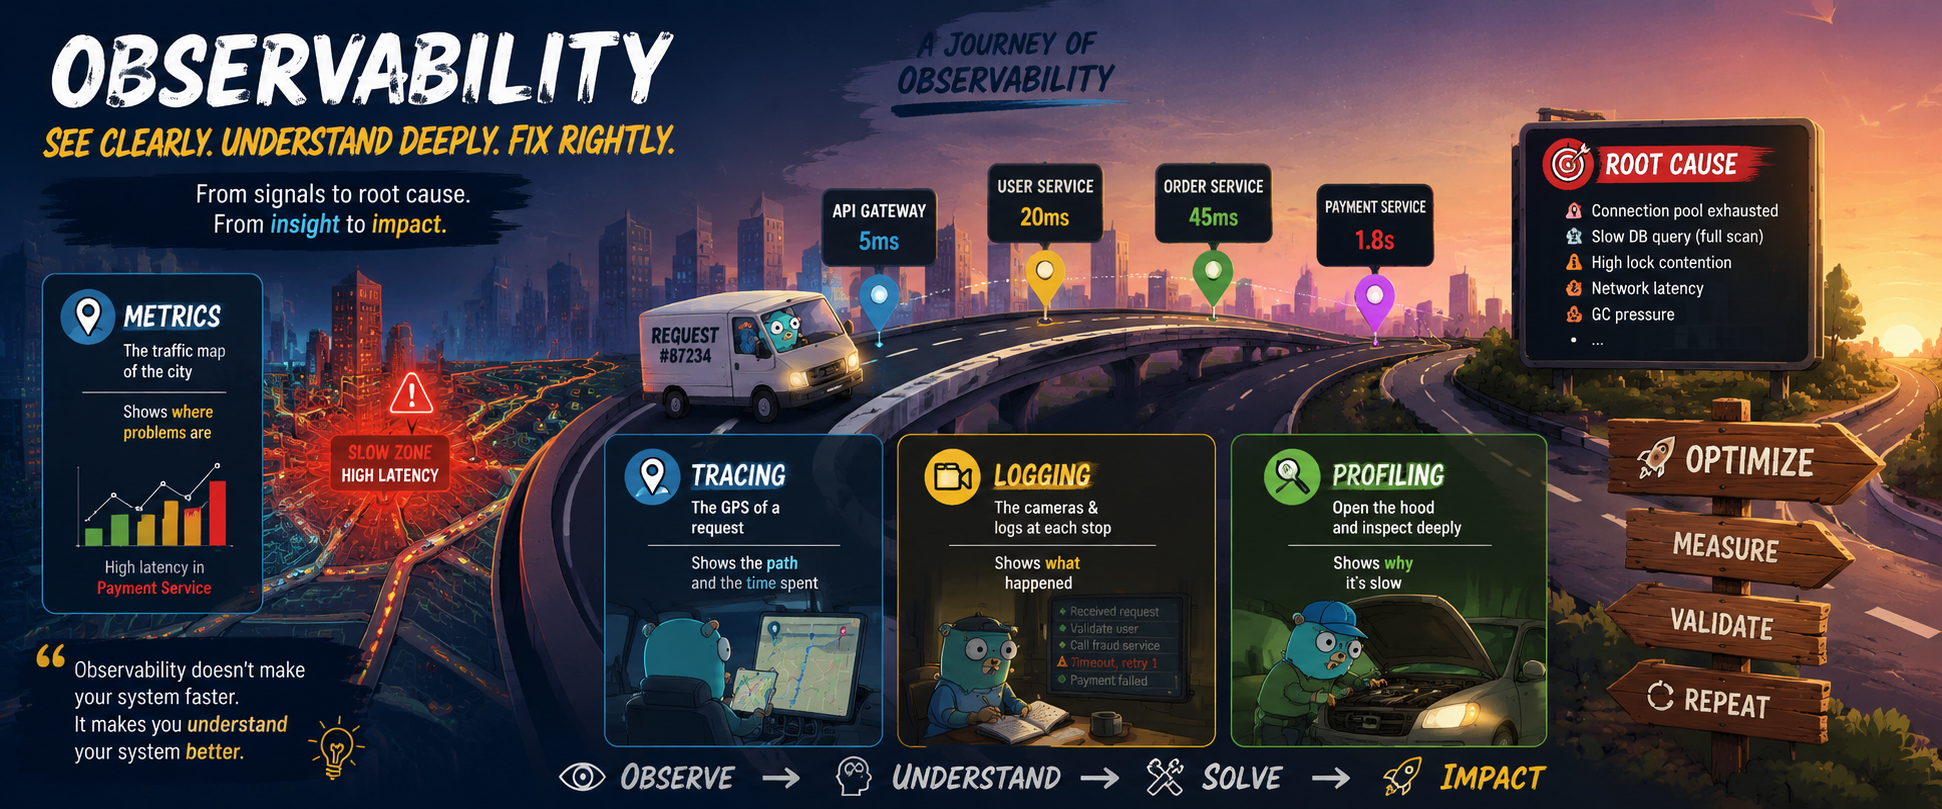
There's a sentence I've heard over and over for fifteen-plus years in this industry — at every company, on every team, at every scale:
"Hey, the system is slow."
And almost immediately, like a reflex, someone will say:
"Probably the queries. Let's optimize the SQL."
I've lost count of how many times I've watched this scene play out. A developer opens their laptop, hunts down the longest query in the codebase, adds a few indexes, rewrites a join, deploys it... and the system is still slow. Because the problem was never in the query. One time it was an exhausted connection pool. Another time, a downstream service stuck in a retry storm. Another time, GC pauses. Once — I swear — it was DNS.
So today, over coffee, I want to ramble a bit about the thing lurking behind all those stories: Observability.
But wait. If you're expecting a tutorial on installing Prometheus, building Grafana dashboards, or wiring up OpenTelemetry, you can close this tab now. This post isn't about tools. It's about something that matters far more: how to ask the right questions when the system misbehaves.
Because in my experience, Observability is not a toolset. It's a method of investigation.
Your system is a city
To make this easier to picture, let me invite you into a little thought experiment.
Imagine your system is a city. A real city, with big roads and small alleys, intersections, industrial districts, warehouses, toll booths.
The API gateway is the city gate. Each service is a neighborhood with its own trade. The database is the central warehouse district, where all the goods are stored. The message queue is a parking lot where trucks wait their turn. The cache is a scattering of small depots near residential areas, so you don't have to drive all the way back to the central warehouse every time.
And every user request? That's a delivery truck.
A user taps "Place order," and a truck rolls out from the city gate. It swings by the identity office to show its papers, stops at the inventory desk, drives to the central warehouse to pick up the goods, passes through the payment toll booth, and finally returns to the gate to hand over the result. That entire journey, to us, collapses into a single number: response time.
When a user complains "the app is slow," what they're really saying is: my delivery truck came back late.
And the engineer's question is not "what should we optimize?" The question is:
Where did that truck get stuck, and why?
This is where the Observability story begins. Because to answer that question, you need to look at your city through several different lenses. And each lens, delightfully enough, maps to one of those "pillars" people love to recite: Metrics, Tracing, Logging, Profiling.
But instead of defining them textbook-style, let me tell you what they are in our city.
Metrics — the traffic map of the whole city
Have you ever opened Google Maps at rush hour? The whole city spreads out before you in streaks of green, yellow, and red. Which roads are flowing, which are clogged, which districts are paralyzed — one glance tells you.
Metrics is that map.
It tells you: the payment district is glowing red, p99 latency tripled starting at 2 PM. The search district is still green, business as usual. Traffic entering the city gate is up 40% from yesterday. The central warehouse is moving slower than it usually does.
That's what Metrics does best: it tells you which area has a problem, and since when.
But there's one thing this map can never tell you. It cannot tell you which truck is stuck. Staring at a red streak on the map, you have no idea where the truck carrying order #4817 for your VIP customer is sitting inside that jam, or why it wandered onto that particular road in the first place.
Metrics answers "where is something wrong?" — but it goes silent when you ask "what is happening to this specific delivery?"
A lot of developers stop right here. They see the dashboard turn red around the database and conclude, "database is slow — time to optimize queries." That's like seeing a red road on the map and concluding "must be the traffic lights," when in fact there's a container truck doing a U-turn in the middle of the street.
The map tells you where to look. It was never the answer.
Tracing — a GPS tracker on each truck
Now, let's strap a GPS tracker onto the truck carrying order #4817.
At the end of the day, you pull up the GPS data, and everything is laid out in crisp detail: the truck left at 14:02:15. It spent 3 seconds at the identity office — a bit long; it's usually half a second. It reached the inventory desk, 200ms, fine. Then it arrived at the central warehouse... and sat there for 8 full seconds. After that, every remaining leg was fast.
That's Tracing.
Tracing narrates the journey of one specific trip: where the truck went, where it stopped, how long each leg took. In a world of microservices, where a single request may travel through a dozen services, tracing is the only thing that shows you the end-to-end picture of one delivery.
And here's the part I want you to pay attention to, because so many people get this wrong:
Tracing only narrows down the location. It does not explain the cause.
The GPS tells you: "the truck sat in front of the central warehouse for 8 seconds." Full stop. It doesn't say why. Was the truck waiting because the warehouse gate was overloaded? Because the security guard took forever checking papers? Because two forklifts inside were fighting over the same aisle? Because the driver... fell asleep?
The GPS doesn't know. The GPS only knows coordinates and timestamps.
I've watched many teams end their investigation right here: they open the trace, see that the database span is the longest one, and instantly conclude "the database is slow." Then they dive into query optimization — right back to the reflex from the beginning of this post. But "time was spent at the database" and "the database is slow" are two very different statements. Maybe the query ran in 5ms, but the connection waited 7,995ms to be handed out from the pool. From the outside, the traces look identical. The root causes are worlds apart.
Once you've narrowed down the location, the investigation is only halfway done.
Logging — traffic cameras and the logbook at every station
Back to truck #4817, parked in front of the warehouse for 8 seconds. How do you find out what happened there? You review the camera footage at the warehouse gate, and you flip open the guard station's logbook.
And in the logbook, you read entries like this:
14:02:19  Truck #4817 arrives at gate, queues behind 12 other trucks
14:02:21  Truck #4817 presents papers, signature missing, correction requested
14:02:24  Truck #4817 calls head office for confirmation — attempt 1 failed
14:02:26  Truck #4817 calls head office for confirmation — attempt 2 succeeded
14:02:27  Truck #4817 cleared to enter warehouse
Ah. So it wasn't that the warehouse was slow. The papers were missing a signature, and the call to head office had to be retried.
That's Logging: each station's own account of what happened. The truck got its delivery rejected. The truck had to turn around. The truck waited for confirmation. The truck retried three times before moving on. Events, decisions, strange detours — the things that neither the map nor the GPS ever records.
If Metrics answers "where?" and Tracing answers "which leg of the journey?", then Logging answers: "what happened?"
But logging has its own trap. A city that mounts cameras on every corner and orders every station to write down everything produces a mountain of footage nobody can watch. A log line without context — no idea which truck it belongs to, no idea which leg of which journey — is just noise. That's why experienced engineers always tie their logs to traces, like stamping the truck's plate number on every logbook entry. So when the time comes, they can reconstruct the full story of exactly one delivery, instead of swimming through millions of lines written by an entire city.
So now we know what happened. But one question remains — the hardest one: why?
Why did the call to head office fail? Why did the identity office take 3 seconds today instead of half a second? To answer that, you have to do something that no map, no GPS, and no camera can do for you.
You have to pop the hood.
Profiling — popping the hood, dissecting the road itself
This is the part I want to linger on, because it's the most narrowly understood of all.
Say "profiling" and most developers immediately think pprof, flame graphs, CPU profiles. Correct — but incomplete. Think bigger.
Truck #4817 is crawling along one stretch of road. The GPS has pinpointed the stretch. The cameras confirm no paperwork drama. And yet the truck is still sluggish. What does a good mechanic do now?
Pop the hood. Is the engine overheating? How's the oil? Any tire running flat?
And if the truck checks out fine, then dissect the road itself: potholes in the asphalt? Construction eating half the lanes? Traffic lights at the intersection running out of sync?
Profiling, in its broadest sense, is deep inspection — looking inside each component to find the true, physical cause of the slowness. And every component in your system has its own hood to pop:
In the application, it's CPU profiling (what is the engine burning its power on?), memory profiling (is the truck overloaded — is fuel leaking somewhere?), mutex profiling (are parts of the machine fighting over one shared resource?), goroutine or thread profiling (how many drivers are idle waiting for work, and how many are stuck?).
In the database, the hood is the query planner: EXPLAIN ANALYZE, the execution plan. It shows you the road the database actually takes to fetch your data — full table scan or index seek, which join strategy, where it sorts, how many pages it pulls off disk. Plenty of people think they know how their query runs. The execution plan exists to prove them wrong.
In the connection pool, it's pool statistics: how many connections are busy, how many trucks are queued waiting for one, what the average wait time looks like. This is the single most overlooked culprit I've encountered in my career — it sits right between the application and the database, and from a distance, both of them look innocent.
In storage, it's disk IO: iostat, read/write latency, queue depth. The warehouse layout can be perfectly sensible, but if the shelves (your disks) are slow to hand over goods, everything above them slows down too.
In the network, it's RTT, packet loss, retransmissions. Sometimes the road isn't narrow at all — the pavement is just bad, and every truck that passes has to slow down. Not one line of your code is at fault.
Do you see the common thread? Tracing can only tell you which stretch of road is slow. Profiling is what answers why that stretch is slow.
These are two entirely different layers of questioning, and they mark the boundary between two kinds of engineers: the one who stops at "the database span is too long," and the one who keeps digging until they reach "ah — the plan went sideways because the statistics were stale, so the planner picked a nested loop instead of a hash join on a ten-million-row table."
Here's a true story I'll never forget. One of our systems would slow to a crawl at every peak hour. Metrics pointed at the database. Traces pointed at the database. The whole team was ready to sit down and rewrite queries. But when we opened the pool statistics, it turned out the queries were finishing in a few milliseconds — the time was going into waiting for a connection, because a background job was hogging nearly the entire pool every 15 minutes. The root cause had nothing to do with SQL. One config change, a repartitioned pool, done.
If we had "optimized the SQL by gut feeling" that day, we'd have burned two weeks fixing nothing.
Fighting for milliseconds while the seconds bleed out on the street
At this point, I have to confess something. Application profiling is... addictive.
You open a flame graph, spot a function eating 12% of CPU, grind it down to 4%, re-measure, and see latency drop by 3 milliseconds — that feeling is good. It gives you the satisfaction of a jeweler: every stroke of the file measurable, visible, braggable. I went through a phase of being hooked on exactly that, spending an entire week polishing one hot path.
Until it dawned on me: in a distributed system, I was fighting for milliseconds inside my own garage while seconds — sometimes minutes — were bleeding out on the street.
Look back at our city. A delivery truck takes 4 seconds for its trip. Within those 4 seconds: 1 second lost at an intersection because of a wrong road sign that sent the truck down the wrong turn and back — a misconfigured timeout, a service discovery entry pointing at a dead node; 1.5 seconds crawling over a stretch full of potholes — a flaky network link, retransmissions all the way; 800ms queuing at the toll booth — an exhausted connection pool, a backed-up queue. And the truck's engine — your application code — contributes... about 40 milliseconds.
And what do we do? We pull the truck into the garage first. Even though the truck, if we're honest, runs just fine.
Hold on. Before you take the engine apart, ask yourself one question — the one I'd tape to your monitor:
Have you actually confirmed the roads are fine? That the signs point the right way? That the toll booths are clear — before hauling the truck in for an upgrade?
Tuning a truck without checking the roads — new turbo, rebuilt engine, racing tires — means that no matter how far you take it, the truck ends up stuck at the exact same intersection. An F1 car still stands dead still at a red light. You cannot buy speed when the thing holding the truck back isn't inside the truck.
Translate that to developers and the picture becomes painfully familiar. No metrics opened, not a single trace followed, not one log line read — but already busy rewriting the service, swapping JSON for protobuf, sprinkling caches everywhere, shoving everything into goroutines, sometimes even demanding a whole new language "for speed." It sounds heroic. But it isn't optimization. It's tuning the truck without ever unfolding the map. And the cost isn't just futility: every "upgrade" makes the system more complex, harder to read, richer in places to break — while the intersection causing the jam sits exactly where it was, waiting for the freshly tuned truck to come back and queue up again.
Why? Partly, yes, because the truck is ours, while the roads belong to "infrastructure," to "some other team." But that's not the deepest reason. The deepest reason is this: most developers don't know those things exist.
Think about it. We are trained, thoroughly, on engines. We learn languages, frameworks, algorithms; we can recite every GC tuning flag and explain exactly how Go slices allocate memory. Our application expertise runs deep. But how a connection pool actually works, what keep-alive does, how many round-trips a TLS handshake costs, what serializing a 5MB payload really burns, how timeouts and retries conspire to become a retry storm — none of that is in any curriculum, no tutorial teaches it, and none of it shows up in your IDE. These things only reveal themselves when a system gets big enough, and painful enough.
And a human being cannot suspect something they don't know exists. On the mental map of a developer who has only ever lived inside the application, those regions are blank space — not "places we'd rather not go," but places that were never drawn at all. So when the system slows down, our eyes automatically sweep to the only territory on the map: our own code. The flame graph isn't the best tool for the problem — it's just the only tool we know how to hold.
Meanwhile — and I mean this sincerely — merely understanding how a connection pool works would have solved a huge share of the performance problems I've seen in my entire career. What pool size is enough, what happens when the pool runs dry, why "the query is fast but the response is slow." One concept, a few hours of reading — in exchange for years of not guessing. Compare that with shaving 5ms off the app with a flame graph while a retry storm out there pours an extra 3 seconds into every request, and you can work out for yourself which investment pays better.
A drop in the ocean. Quite literally.
So when is popping the application's hood the right call? Two cases. One: when the investigation has ruled out the roads — metrics, tracing, and logging all point at the truck, and you're certain this is the last remaining leg. Two: when you suspect a leak — a memory leak, a goroutine leak, a connection leak. Leaks are the special exception: they don't cost you a few milliseconds; they accumulate silently, like a crack in the chassis, until the day the whole truck dies on the road. With a leak, popping the hood isn't premature — it's usually overdue.
If you find yourself in either of those cases, I've written a separate piece on giving your application a proper medical exam: Profiling: Diagnosing a Golang Application. If not — go back to the map.
A well-planned city rarely needs an investigation
There's one more layer to this story — the one people rarely say out loud, and the one I consider most important.
A well-architected application is like a well-planned city: everyone can see that it's good, and when one detail breaks, everyone knows immediately which detail it is. Roads are roads, districts are districts, boundaries are clear, flows are predictable. In a system like that, most of the cost of investigation simply... evaporates. One glance at the metrics and the team has the problem cornered, because the structure of the system is itself a legible map. The best observability, it turns out, starts with an understandable architecture — not with mounting more cameras.
It's the opposite direction that should scare you. When you make one corner of the system ugly — or see that it's ugly and leave it alone — three things happen, and every one of them escalates. First, you yourself won't want to come back and fix it; the longer it sits, the heavier the dread. Second, you forfeit your standing to ask anyone else to fix their corner — your code reviews go soft from that day on, because everyone knows whose mess is sitting over there. Third, and worst of all: the first ugliness becomes the precedent for every ugliness after it. One broken window that nobody replaces, and soon the whole block is shattered. A new engineer joins the team, looks around, concludes "so this is how things are done here," and does the same. Systems rarely decay through one big bad decision — they decay through a chain of small "eh, whatever"s.
None of this means everything must be perfect. Every city has potholes it can't fix yet — no budget this quarter, no free hands this sprint. Technical debt is allowed. It's a legitimate financial instrument: borrow speed today, repay with effort tomorrow. But there are two very different kinds of debt. The pothole with barriers and a warning sign around it — an honest // TODO, a ticket in the backlog, a line in an ADR that says "this is temporary, because of X, to be repaid by Y" — that is debt you can repay. The pothole hastily covered with a thin plank and then... forgotten — that's no longer debt. It quietly becomes terrain. A few years later, someone builds an entire new road curving around it, and nobody remembers why the road bends.
So if you must leave something ugly, leave it ugly on the record. Debt that's written down is debt that can be repaid. Debt that isn't, sooner or later, becomes part of the city.
A senior engineer doesn't optimize by intuition. They investigate.
By now, you can probably see the thread I've been pulling. Each layer of observation answers one question, and the questions chain together like an investigation:
Metrics    →  Which district of the city has a problem?
Tracing    →  Which leg of this specific trip was slow?
Logging    →  On that leg, what happened?
Profiling  →  Why did it happen? What's wrong inside?
    ↓
Root Cause →  The actual cause
    ↓
Optimization →  Only now do you optimize
Notice something: optimization is the last step. It's the reward for a proper investigation — not the starting point.
Meanwhile, the reflex out in the wild is a deadly shortcut:
"The system is slow" → "Optimize the SQL"Jumping straight from symptom to solution, skipping the entire investigation. It's like a doctor hearing "my stomach hurts" and going straight to... removing the appendix. Sometimes they get lucky. But lucky is all it is — it's not understanding. And in this profession, the most dangerous thing is a streak of lucky guesses, because it trains you to keep guessing until the day the bill comes due.
People like to think the difference between a junior and a senior engineer is that the senior knows more technologies, types faster. I don't think so. The biggest difference is this: when the system breaks, a junior proposes solutions; a senior proposes questions.
The junior says: "Probably the query — let me add an index." The senior asks: "Slow since when? Slow on which endpoint? All requests, or one cohort? Did p50 rise, or only p99? Anything deployed recently?"
The senior looks slower at the start. But the one who walks slowly at the beginning usually reaches the finish line first, because they never have to turn around halfway.
Two interview questions that sound alike — and couldn't be more different
Now let me tell you something I've come to realize after years of sitting on both sides of the interview table.
There are two questions that sound almost identical:
"What do you do to optimize a query?"
and
"What do you do to optimize performance?"
At first they sound like the same question. But to me, they are completely different — and how a candidate answers tells me a great deal about their level.
"Optimizing a query" is a story that lives inside a single component: the database. Add indexes, read execution plans, rewrite the query, kill the N+1, partition the table. It's a good skill, a necessary one, and one you can learn fairly quickly. It's like being a mechanic who's brilliant with engines: hand me the engine, and I'll make it sing.
"Optimizing performance" is a different story altogether. It's the story of the entire city. Because when a delivery truck comes back late, the cause could be anywhere: the application serializing a monstrous payload; a cache stampede because a thousand keys expired at once; packet loss on the link between two services; an exhausted connection pool; two threads wrestling over one lock; a GC pausing the world for a few hundred milliseconds; one slow downstream service dragging everything down with it; a backed-up queue; a busy disk; and — yes — possibly the database.
The database is just one link in that chain. An important link. But still just one.
Which leads to something that sounds backwards at first but feels perfectly natural once it sinks in:
Someone who only knows how to optimize queries may not know how to optimize performance. But someone who knows how to optimize performance must, without exception, know how to investigate before concluding.
Because you cannot optimize an entire city by being good at fixing engines. You have to know how to read the map, follow the GPS, flip through the logbooks, and know when to pop the hood — and pop the hood of the right truck, on the right stretch of road.
When a candidate answers the "optimize performance" question by starting with "first, I'd look at the metrics to narrow down where..." — I know I'm talking to someone who has genuinely wrestled with production. When a candidate starts with "I'd add an index" — I know they're answering a different question. The question they wish I had asked.
That difference, named plainly, is the difference between treating symptoms and finding root causes. Treat the symptom, and the system runs quietly for a while — until the problem returns wearing a different face. Find the root cause, and that problem is gone for good. And more importantly: you now understand your system one layer deeper than before.
A few closing thoughts, in place of a conclusion
The coffee is almost gone, so let me close with a thought that sinks in deeper the longer I do this work.
Observability does not make your system faster. Install ten more dashboards, and your system will be exactly as slow as it was. What Observability gives you is something else: it makes you understand your system. And that understanding is the foundation of every optimization worth the name.
I used to think a great engineer was someone who knew a lot of tools. I think differently now. Tools come and go — ten years ago we talked about Nagios, today we talk about OpenTelemetry, ten years from now it'll be some other name. But the way you ask questions — that stays. A great engineer is not someone who knows many tools. A great engineer is someone who knows how to ask the right questions. "Where is it slow?" before "which leg of the journey?", before "what happened?", before "why?". In that order. No skipping steps. No guessing.
And if I had to compress this whole rambling post into two sentences, these are the two I'd keep:
Performance does not begin with optimization. Performance begins with observation.
The next time someone rushes to your desk saying "hey, the system is slow," don't reach for the SQL file. Unfold the city map first.
Somewhere out there, a delivery truck is stuck in traffic. And our job is not to guess where — it's to go find it.
That, to me, is what Observability really means.
Comments